Today’s post is a continuation of yesterday’s post How Many Checkpoints are Issued During a Full Backup? and the investigation of Database Engine Internals with Extended Events. In today’s post we’ll look at how Backup’s work inside of SQL Server and how to track the throughput of Backup and Restore operations. This post is not going to cover Backups in SQL Server as a topic; if that is what you are looking for see Paul Randal’s TechNet Article Understanding SQL Server Backups.
Yesterday I mentioned that there is only one Event in Extended Events that has the word backup in it's name, and that Event is the sqlserver.backup_and_restore_throughput Event. At first glance this Event looks pretty dull. It only returns three columns, database_id, count, and increment, and doesn’t really tell us what count and increment mean in the metadata.
-- Get the Event columns

	SELECT

	    OBJECT_NAME,

	    name,

	    type_name,

	    description

	FROM sys.dm_xe_object_columns

	WHERE OBJECT_NAME LIKE '%backup%'

	  AND column_type = 'data'
I could step you through what I did to look at this Event and figure out the meaning of things, but that would make an already long post longer. Essentially I created an Event Session with just this Event and used the sqlserver.session_id Predicate to only capture it for a specific session_id that I was going to run a FULL backup from. The count column is the total number of bytes that have been written to backups and the increment column is the current number of bytes that were written when the Event fired (we’ll see this more in a minute). This was interesting to see so I started thinking about what kind of information I would want to know about Backups that related to the throughput and two items came to mind almost immediately; read operations from the database, and wait statistics related to the Backup occurring, both of which are available through Extended Events. I also recalled that there were a few documented Trace Flags associated with Backup and Restore operations that output more verbose information through Trace Prints. Trace Flag 3004, outputs what operations Backup and Restore are performing (How It Works: What is Restore/Backup Doing?). Trace Flag 3213, outputs the Backup Buffer configuration information as discussed on the SQLCAT team blog series Tuning the Performance of Backup Compression in SQL Server 2008 and Tuning Backup Compression Part 2. Trace Flag 3014, outputs additional information about Backup and File operations (How It Works: How does SQL Server Backup and Restore select transfer sizes). There happens to be a sqlserver.trace_print Event that can capture the trace output as a part of our Event Session.
Using yesterday’s post as a foundation for the Event Session in today’s post, and the same Sample_Reporting Database, lets look at the Event Session that we’ll use to investigate Backups.
-- Create the Event Session

	CREATE EVENT SESSION BackupMonitoring

	ON SERVER

	ADD EVENT sqlserver.sql_statement_starting

	(   ACTION (sqlserver.database_id, sqlserver.sql_text)

	    WHERE (sqlserver.session_id = 97)),

	ADD EVENT sqlserver.sql_statement_completed

	(   ACTION (sqlserver.database_id, sqlserver.sql_text)

	    WHERE (sqlserver.session_id = 97)),

	ADD EVENT sqlserver.databases_backup_restore_throughput

	(   WHERE (sqlserver.session_id = 97)),

	ADD EVENT sqlos.wait_info

	(   ACTION (sqlserver.database_id)

	    WHERE (sqlserver.session_id = 97  AND duration > 0)),

	ADD EVENT sqlos.wait_info_external

	(   ACTION (sqlserver.database_id)

	    WHERE (sqlserver.session_id = 97  AND duration > 0)),

	ADD EVENT sqlserver.trace_print

	(   WHERE (sqlserver.session_id = 97)),

	ADD EVENT sqlserver.file_read

	(   WHERE (sqlserver.session_id = 97)),

	ADD EVENT sqlserver.file_read_completed

	(   WHERE (sqlserver.session_id = 97)),

	ADD EVENT sqlserver.physical_page_read

	(   WHERE (sqlserver.session_id = 97)),

	ADD EVENT sqlserver.databases_log_cache_read

	(   WHERE (database_id = 41)),

	ADD EVENT sqlserver.databases_log_cache_hit

	(   WHERE (database_id = 41)),

	ADD EVENT sqlserver.databases_log_flush

	(   WHERE (database_id = 41)),

	ADD EVENT sqlserver.checkpoint_begin

	(   WHERE (database_id = 41)),

	ADD EVENT sqlserver.checkpoint_end

	(   WHERE (database_id = 41))

	ADD TARGET package0.asynchronous_file_target(

	     SET filename='C:\SQLBlog\BackupMonitoring1.xel',

	         metadatafile = 'C:\SQLBlog\BackupMonitoring1.xem')

	GO

	-- Alter the Session to Start it

	ALTER EVENT SESSION BackupMonitoring

	ON SERVER

	STATE=START

	GO
There is a lot of information being collected in this Event Session. We are going to get the sql_statement_starting and completed Events, the backup_restore_throughput Event, wait_info Event for SQLOS waits inside of SQL Server and the wait_info_external Event for preemptive waits outside of SQL Server, the trace_print Event to capture our Trace Flag outputs, the file_read, file_read_completed, and physical_page_read Events to capture read operations from the session_id performing the Backup, the database_log_cache_read, database_log_cache_hit, and database_log_flush Events to track transaction log cache operations during the Backup, and the checkpoint_begin and checkpoint_end Events to track checkpoint occurrence during the backup and how they might impact throughput. If you notice, some of the Events are Predicated on the session_id, while others are predicated on the database_id, and this is very intentional in the definition of this Event Session. Some Events do not fire in the context of a specific database_id, and some Events do not fire in the context of a specific session_id, and some will fire for both. Where the database_id is a practical Predicate for the Event, and it is carried in the Events base payload, it is a natural item to use for a Predicate. Restricting Events to a specific database_id or session_id will prevent Event capture from other operations occurring on the SQL Server.
With our Event Session defined and started, we can now run a Backup of the database and see what we capture. I am going to show two different Backup configurations in this post, based on the information contained in the SQLCAT series on tuning Backup Performance in SQL Server 2008. The first one uses a default configuration for the BUFFERCOUNT and MAXTRANSFERSIZE Backup options, but also uses Database Compression since it is available to minimize he backup file size, and maximize the throughput of the backup operation.
BACKUP DATABASE [Sample_Reporting]

	TO  DISK = N'B:\SQLData\MSSQL10.MSSQLSERVER\MSSQL\Backup\Sample_Reporting1.bak'

	WITH NOFORMAT,

	    NOINIT,

	    NAME = N'Sample_Reporting-Full Database Backup Number 1',

	    SKIP,

	    NOREWIND,

	    NOUNLOAD,

	    COMPRESSION,

	    STATS = 5

	GO
On this server, the backups are writing to a dedicated RAID1 disk array using two 146GB 15K RPM SAS drives. When the backup completes we can begin our analysis of the Events captured by our Event Session. To make it possible to perform various types of analysis of the data contained inside of the asynchronous_file_target, I am going to read the Raw XML Event data into a temporary table, and then shred the XML into a second temporary table, making it possible to just query the shredded data.
DROP TABLE #EventData

	DROP TABLE #TestResults
-- Create intermediate temp table for raw event data
CREATE TABLE #EventData
(Rowid INT IDENTITY PRIMARY KEY, event_data XML)-- Create final results table for parsed event data
CREATE TABLE #TestResults
(Rowid INT PRIMARY KEY, event_name VARCHAR(50), package_name VARCHAR(50),
[timestamp] datetime2, database_id INT, trace_print NVARCHAR(4000),
[count] bigint, increment bigint, wait_type NVARCHAR(100), opcode NVARCHAR(10),
duration bigint, max_duration bigint, total_duration bigint, signal_duration bigint,
completed_count bigint, source_database_id INT, [object_id] INT, object_type INT,
[state] NVARCHAR(50), offset bigint, offset_end INT, nest_level INT, cpu INT,
reads bigint, writes bigint, mode NVARCHAR(50), FILE_ID INT, page_id INT,
file_group_id INT, sql_text NVARCHAR(4000))-- Read the file data into intermediate temp table
INSERT INTO #EventData (event_data)
SELECT
CAST(event_data AS XML) AS event_data
FROM sys.fn_xe_file_target_read_file('C:\SQLBlog\BackupMonitoring1*.xel', 'C:\SQLBlog\BackupMonitoring1*xem', NULL, NULL)-- Query the Event data from the Target.
INSERT INTO #TestResults
(Rowid, event_name, package_name, [timestamp], database_id, trace_print,
[count], increment, wait_type, opcode, duration, max_duration, total_duration,
signal_duration, completed_count, source_database_id, [object_id], object_type,
[state], offset, offset_end, nest_level, cpu, reads, writes, mode, FILE_ID,
page_id, file_group_id, sql_text)SELECT
RowID,
event_data.value('(event/@name)[1]', 'varchar(50)') AS event_name,
event_data.value('(event/@package)[1]', 'varchar(50)') AS package_name,
DATEADD(hh,
DATEDIFF(hh, GETUTCDATE(), CURRENT_TIMESTAMP),
event_data.value('(event/@timestamp)[1]', 'datetime2')) AS [timestamp],
COALESCE(event_data.value('(event/data[@name="database_id"]/value)[1]', 'int'),
event_data.value('(event/action[@name="database_id"]/value)[1]', 'int')) AS database_id,
event_data.value('(event/data[@name="message"]/value)[1]', 'nvarchar(4000)') AS trace_print,
event_data.value('(event/data[@name="count"]/value)[1]', 'bigint') AS [count],
event_data.value('(event/data[@name="increment"]/value)[1]', 'bigint') AS [increment],
event_data.value('(event/data[@name="wait_type"]/text)[1]', 'nvarchar(100)') AS wait_type,
event_data.value('(event/data[@name="opcode"]/text)[1]', 'nvarchar(10)') AS opcode,
event_data.value('(event/data[@name="duration"]/value)[1]', 'bigint') AS duration,
event_data.value('(event/data[@name="max_duration"]/value)[1]', 'bigint') AS max_duration,
event_data.value('(event/data[@name="total_duration"]/value)[1]', 'bigint') AS total_duration,
event_data.value('(event/data[@name="signal_duration"]/value)[1]', 'bigint') AS signal_duration,
event_data.value('(event/data[@name="completed_count"]/value)[1]', 'bigint') AS completed_count,
event_data.value('(event/data[@name="source_database_id"]/value)[1]', 'int') AS source_database_id,
event_data.value('(event/data[@name="object_id"]/value)[1]', 'int') AS OBJECT_ID,
event_data.value('(event/data[@name="object_type"]/value)[1]', 'int') AS object_type,
event_data.value('(event/data[@name="state"]/text)[1]', 'nvarchar(50)') AS state,
event_data.value('(event/data[@name="offset"]/value)[1]', 'bigint') AS offset,
event_data.value('(event/data[@name="offset_end"]/value)[1]', 'int') AS offset_end,
event_data.value('(event/data[@name="nest_level"]/value)[1]', 'int') AS nest_level,
event_data.value('(event/data[@name="cpu"]/value)[1]', 'int') AS cpu,
event_data.value('(event/data[@name="reads"]/value)[1]', 'bigint') AS reads,
event_data.value('(event/data[@name="writes"]/value)[1]', 'bigint') AS writes,
event_data.value('(event/data[@name="mode"]/text)[1]', 'nvarchar(50)') AS mmode,
event_data.value('(event/data[@name="file_id"]/value)[1]', 'int') AS FILE_ID,
event_data.value('(event/data[@name="page_id"]/value)[1]', 'int') AS page_id,
event_data.value('(event/data[@name="file_group_id"]/value)[1]', 'int') AS file_group_id,
event_data.value('(event/action[@name="sql_text"]/value)[1]', 'nvarchar(4000)') AS sql_text
FROM #EventData
ORDER BY Rowid-- Look at the Results.
SELECT
Rowid,
event_name,
database_id,
trace_print,
[count],
increment,
wait_type,
duration,
signal_duration,
cpu,
reads,
writes,
mode,
FILE_ID,
page_id,
file_group_id,
sql_text
FROM #TestResults
ORDER BY Rowid
In the above query, I am extracting all of the data elements from the Event data, even though in the final query I am not using all of the data. I did this to have a complete example of how to shred the XML, and because we are storing it in a temp table, we may find that we want to come back and look at specific data elements that were excluded in the initial look at the results. From our results we can begin to understand how Backup Operations work inside of SQL Server.
Here we can see the statement starting to execute, and the first output from the trace_print Event showing that the backup of the database was starting, along with the external waits associated with performing file operations to create a Backup file for the database.
Here the newly created Backup file is opened an 1K of write occur to the file before it becomes ready for the Backup.
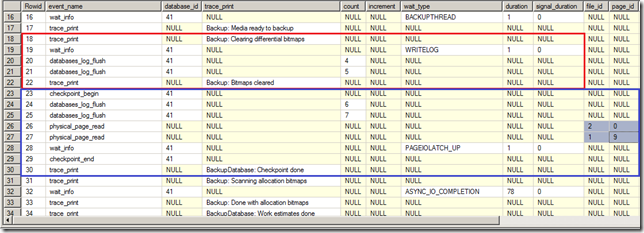
Here we can see two operations being performed. In the red outlined box, since we are doing a full Backup of the database, the differential bitmaps, pages that track which extents in a GAM interval have been modified since the last full or differential backup (Inside the Storage Engine: Anatomy of an extent), are cleared. In the blue outlined box, we see the checkpoint triggered by the Backup operation begin, and in the four highlighted boxes in grey, we see two physical_page_reads occur for the database, one from the transaction log, and one from the primary data file. These are the pages that are written to when Checkpoint occurs in the database. The file_id 2 page_id 0 page is where the Log Sequence Number is written to the log file, and file_id 1 page_id 9 is the database boot page, where the LSN is also written to at checkpoint (Checkpoints and the Active Portion of the Log). We also see the wait_info event for the PAGEIOLATCH_UP wait to update of this information.
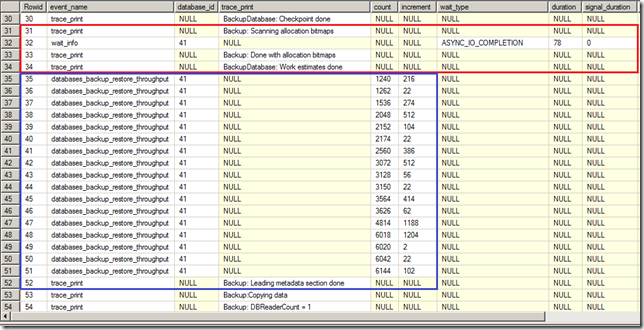
Next the allocation bitmaps for the database are scanned and an estimate of the work is performed (red box) before writing 5K of metadata into the backup file.
At this point the Backup process is ready to begin copying data to the Backup file. Since this particular database only has 1 data file, only one reader is assigned to the backup (Optimising Backup & Restore Performance in SQL Server). When the Backup starts on the file, an additional 1024 bytes (1K of information is written to the Backup file and the file read operations against the database data file(s) commences.
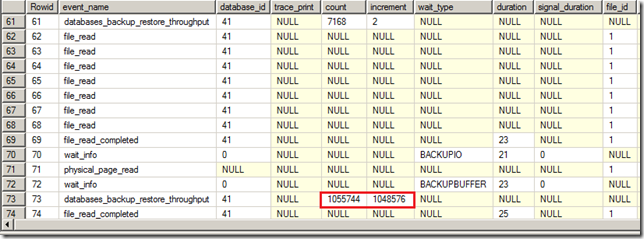
As the backup of the data file data begins, we see a change in the size of the increment being written to the Backup file, and now we have 1MB segments of data being written to the file.

We can also see that multiple 1MB segments are written within milliseconds of each other. Now I could spend a lot of time running through the entire set of Events showing the same thing, but with 187,698 Events for a 110 second Backup, that would take forever. Instead I am going to skip over all the interim file reads and Backup file writes and get to the end of the data file section.
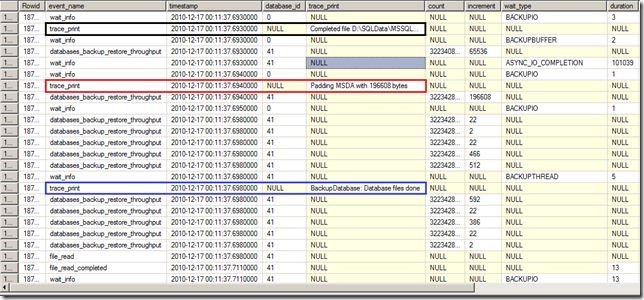
Highlighted in black above, we see the completion of the first data file, followed by a trace_print event, in red, Padding MSDA with 196608 bytes (192K of space), and then the trace_print event, in blue, showing the completion of all Database files, which is also the beginning of the Transaction log portion of the backup.
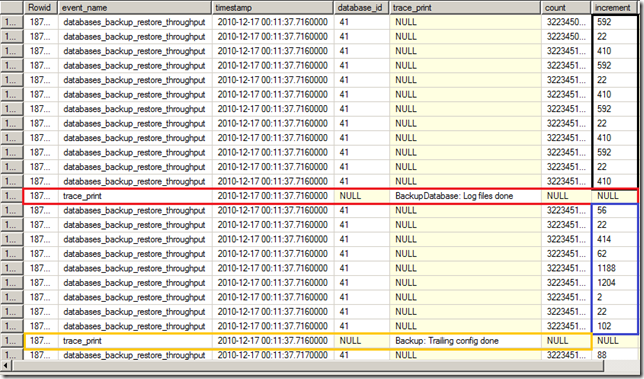
Here we can see that the size of the log information being backed up, highlighted in black, is significantly different from the data file information which is to be expected since log records are very different from data records in composition. When the log files done trace_print Event in red, and the trailing configuration writres in blue and the trace_print Event in orange marking the completion of the trailing configuration.
I don’t know what MBC done means, and I couldn’t find it online, but it completed here. I think it might stand for MaxBufferCount, and the above line shows that all of the buffers have been written out for the backup. (Don’t quote me on that I am just taking a SWAG there!)
After the MBC is done, the backup history records are written into MSDB.
And finally the backup completes. So far all that we’ve done is look at all of the information that we can get, and there is a lot of it, but unless we can do something actionable with all this information, there is no real point in gathering it. I originally intended to only cover one post on this subject but its become quite large, so I am splitting it into two posts and in tomorrow’s post we’ll look at how we can use the information captured in today’s post to validate whether or not changes to our backup process have a positive or negative impact on backup times and throughput.


