(New for 2020: we’ve published a range of SQL Server interview candidate screening assessments with our partner Kandio, so you can avoid hiring an ‘expert’ who ends up causing problems. Check them out here.)
(Check out our Pluralsight online training course: SQL Server: Improving Storage Subsystem Performance.)
In this post I explain some methods for investigating and reducing high tempdb and transaction log I/O latencies that can severely hamper the performance of your workload.
Back at the end of August I kicked off a survey asking you to run some code to calculate average I/O latencies and send me the results. I have to apologize for taking two months to get to this editorial as I kept putting off spending the time to collate all the results I was sent. I made up for it by putting in lots of useful information :-)
I received results from 1094 random servers around the world (thank you all!) hosting 25445 databases and it took me a while to pull all the results into SQL Server so I could aggregate the data. Here it is.
What is Good or Bad?
For everything we’re talking about, you have to consider two things:
- What is good or bad for I/O latency?
- Even if you have “bad” I/O latency, do you care?
Everyone has their idea of what constitutes good or bad I/O latency, and here’s my take:
- Excellent: < 1ms
- Very good: < 5ms
- Good: 5 – 10ms
- Poor: 10 – 20ms
- Bad: 20 – 100ms
- Shockingly bad: 100 – 500ms
- WOW!: > 500ms
You may want to argue that my numbers are too high, too low, or wrong, based on what you’ve seen/experienced, and that’s fine, but this is my blog and these are my numbers :-) You may not be able to get to my Excellent or Very Good numbers unless you’re using the latest locally-attached flash storage and aren’t driving them hard with your workload. Remember these are just my guidelines, not any kind of rule that SQL Server requires.
Even if your I/O latency is in what I consider the “bad” category, it could be that your workload is performing within the acceptable bounds for your organization and your customers, and so you’re comfortable with that. I’m OK with this, as long as you are aware of your I/O latencies and you’ve consciously decided to accept them as they are. Being ignorant of your I/O latencies and just accepting the workload performance as it is, because that’s just what the performance is, is not acceptable to me.
On to the survey data…
Tempdb Data Files
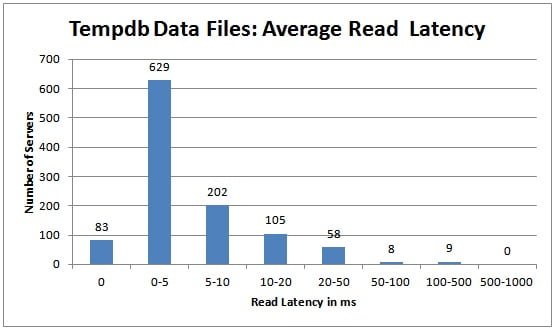
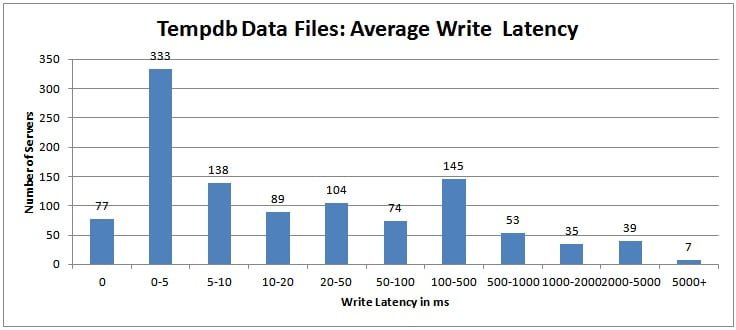
For this data I worked out the average read and write latency over all tempdb data files for each instance. I didn’t see any instances where one tempdb data file had a huge latency compared to the others so I believe this is a valid approach.
The tempdb data file read latencies aren’t too bad, to be honest, with more than 93% of all the servers in the survey having read latencies less than 20ms.
This is very interesting – almost 42% of all the servers in the survey had average tempdb data file write latency of more than 20ms, and just over 12% of all servers had average tempdb data file write latency of more than half a second per write – that’s ridiculously high!
To be honest, I’m pretty shocked by these results. especially the relatively high number of servers with multi-second average write latencies for tempdb.
So if you check your average I/O latency for tempdb (using a script such as the one I blogged here, using sys.dm_io_virtual_file_stats) and find that it’s really high on my (or your) scale, what can you do?
Well, there are four approaches I can think of:
- Don’t do any investigation and just immediately move tempdb to a faster I/O subsystem, such as two SSD cards in a RAID-1 configuration (remember, one SSD is RAID-0, and that’s not good enough because if tempdb is corrupt or unavailable, your instance shuts down!). You might think that this is the lazy approach, but if you *know* you can’t make any changes to workload, this may be your only option. I bumped into this scenario while working with a client that supplies casino software. The optimal solution was to change some SPs to reduce tempdb usage, but that was going to take 18 months to be approved by the Gaming Commission in the state where the client’s client was located. The only solution in the meantime? Pony up for a faster tempdb I/O subsystem.
- Investigate the I/O subsystem where tempdb is located, looking for things like (non-exhaustive list):
- Pathing/network issues, such as having a 1Gb switch in the middle of a 4Gb path, or having mismatched jumbo frame settings in your iSCSI configuration, or where the network to the SAN is being saturated by something other than SQL Server I/O traffic.
- Incorrect SAN settings, such as not having write-caching enabled for a write-heavy workload, incorrect queue depth compared to your SAN vendor’s recommendations, or tempdb stuck on slow storage on an auto-tiering SAN because of incorrect SAN training.
- Multiple users of the portion of the I/O subsystem where tempdb is located, such as having tempdb lumped in with other volatile databases, or even having LUNs shared between SQL Server and other applications like Exchange or IIS.
- Only having a single tempdb data file so missing out on the usual higher I/O subsystem performance gained from having multiple data files in a filegroup (note: don’t confuse this with adding more tempdb data files to reduce PAGELATCH_XX contention on in-memory allocation bitmaps.)
- Try to reduce the usage of tempdb, by looking for (non-exhaustive list):
- Spill warnings in query plans (hash, sort, or exchange) indicating that there was not enough query execution memory and an operator had to spill results to tempdb. See these blog posts for more information: here, here, here, and a blog post of mine explaining how to understand the data vs. log usage for a memory spill to tempdb here.
- Incorrect, excessive usage of temp tables, such as *always* using a temp table when it may be better sometimes to not do so, pulling more columns or rows into a temp table than are actually required (e.g. SELECT * into the temp table from a user table, with no WHERE clause), creating nonclustered indexes on a temp table that are not used. I’ve seen this over and over with client code.
- Index rebuilds that use SORT_IN_TEMPDB.
- Using one of the flavors of snapshot isolation and allowing long-running queries that cause the version store to grow very large.
- There are lots of useful queries and other information in the whitepaper Working with tempdb in SQL Server 2005 (which is still applicable to all current versions.)
- A combination of #2 and #3, and then maybe you just have to move to a faster I/O subsystem, as in #1.
One other thing to consider is the risk of making a change to your code and/or the cost of the engineering effort (dev and test) to do so. It may be cheaper and less risky to move to a faster I/O subsystem. Your call. Another issue you may have is that the bad code is in a 3rd-party application that you have no control over. In that case you may have no choice except to throw hardware at the problem.
Transaction Log Files
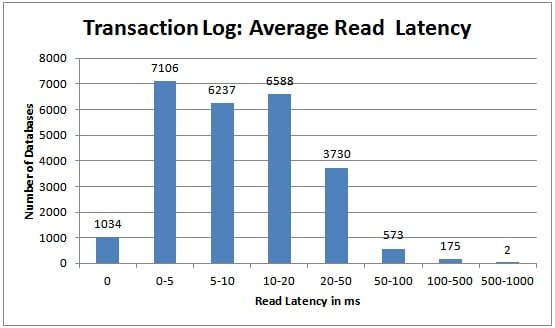
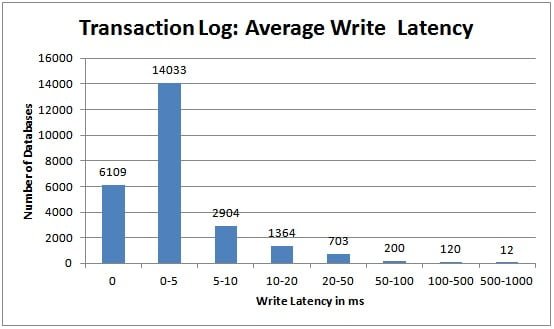
For this data I considered each database separately rather than aggregating per instance.
For the transaction log, you really want the average write latency to be in the 0-5ms range, and it’s good to see more than 79% of transaction log files in the survey are achieving that. I would say that write latency for the transaction log is much more important than read latency, as write latency slows down transactions in your workload. That’s not to say that you should ignore high read latencies, as these slow down log readers (such as log backups, transactional replication, change data capture, asynchronous database mirroring/availability groups), but log read latencies don’t usually slow down your workload unless you have transactions that are rolling back (the only time that transactions will cause log reads) or you rely heavily on change data capture.
So you’re focusing on write latency. Again, there are multiple approaches that are the same as #1-#4 above. What you’re looking for in approach #3 is different though. I’ve written several detailed posts about transaction log performance tuning (including reducing the amount of log generated and changing the log block flush pattern) for SQL Sentry’s SQLPerformance.com blog so rather than duplicate those, I’ll point you to them:
- Trimming the Transaction Log Fat – common problems that lead to poor transaction log performance.
- Trimming More Transaction Log Fat – more subtle problems that contribute to poor transaction log performance.
- Transaction Log Configuration Issues – self-explanatory.
And then there’s my 8-hour Pluralsight online training class that covers SQL Server: Understanding Logging, Recovery, and the Transaction Log.
Summary
It’s really important that you pay attention to the read and write I/O latencies for critical components of your SQL Server environment: tempdb and transaction logs. I’ve given you a lot of info above on what you can do inside and outside SQL Server to reduce these latencies and increase your workload throughput.
Unless you have no choice, don’t just throw some SSDs into the mix without first figuring out whether there are some things you can do inside SQL Server to reduce the I/O load, and if you do throw in some SSDs, make sure that you’re using them to host whatever files are your biggest I/O bottleneck, and make sure you’re using at least two of them in a RAID-1 configuration to protect against failure.
I hope this has been a useful read – happy tuning!


22 thoughts on “Are I/O latencies killing your performance?”
Hi Paul,
May log file fragmentation has any influence on latency?
No – not on I/O latency – but can cause other problems.
Hi Paul,
two wonderful post, i have redesigned my SAN storage based on above suggestions.
i have couple of questions for you.
1)Index rebuilds that use SORT_IN_TEMPDB – why this is not recommended
2)do i have to multiple or divide by 2 for write/read latencies on RAID on config (also for RAID 5)
Thanks
Praveen
1) there’s no best approach to rebuilding indexes as it depends on the DOP and how much space is required, plus the availability of contiguous free space in the database
2) I don’t know
There are no penalties for reads regardless of RAID level. There is a write penalty of 4x four RAID 5: read the data, read the parity, write the data, write the parity.
Love this article…helping me reconfigure my tempdb configs across the board. Quick followup. We have some dedicated SQL 2008 Std boxes, being replicated to and accessed via load balancing for our web site. Things working normal on the application side due to some well-designed caching. However, there is sluggishness on the box itself when we access it, possibly due to the fact there is only 1 disk, partitioned into C and D, and all files for all DB’s are all on the D drive, with 8 tempdb files. I know the round-robin activity would make sense on more files IF tempdb was on it’s own physical drive or SAN, but in this case maybe not.
In this scenario, where ALL files are on the same partition, and no plan to move it on the horizon (I pester the business regularly about it though, but cached replicated servers are cheap and easy to setup), would reducing tempdb files down to only 1 or 2 be a good idea in this case, just make them a bit larger, to minimize the round-robin effect which I suspect may be a detriment in this case?
Thanks.
Impossible to say without you making changes and benchmarking their effect against a baseline.
84 1916 1121 57244 67756 63196 T: tempdb T:\SQL_TempDB\Tempdb01.mdf
84 1914 1120 57310 67769 63235 T: tempdb T:\SQL_TempDB\Tempdb03.ndf
84 1902 1112 57457 67745 63275 T: tempdb T:\SQL_TempDB\Tempdb02.ndf
85 1898 1110 57511 67730 63286 T: tempdb T:\SQL_TempDB\Tempdb04.ndf
Hi Paul, Above are the stats that I received from the script that you had posted elsewhere for my tempdb. The second column is the write latency. And going by your numbers, it is in the WOW category :)
I was wondering the aspects I need to consider and document so that I can take it up with the hardware vendor who is a 3rd party to my client and we just moved to this piece of junk of an infrastructure.
I got as much information as I can – it is a Netapp filer using 2048KB of NVRAM cache for writes. We have 4 tempdb files but they are all residing in the same drive. So not sure about the spindles etc.
I am presently getting about 2700 IOPS when I am trying to perform an insert of about 10million rows onto a 300 million rows table. The write latency onto the actual data files are in the high 50 ms. bad, still I can live with that. My target table is partitioned and does not have any indexes apart from the partitioning key acting as a clustered index.
Inspite of having all of this, I still am experiencing very slow write speeds and I am at my wit’s end trying to figure out how to go about making them quicker. I use SAP BODS for inserts and bulk copy is not an option for this target table. I am using a maxdop of 4 and I get a lot of PAGELATCH_SH,XX etc. So all this tells me that my I/O subsystem seems to struggle. But unless I can categorically prove that this is the case, the 3rd party vendor has a habit of turning around and calling my application crap.
I have done whatever I can to make the target table performing and yet, such slow inserts are really making me anxious.
Any pointers would be highly helpful. Appreciate you posting such useful aspects.
Way beyond the scope of a blog comment I’m afraid – check out the advice at http://www.sqlskills.com/sql-server-performance-tuning. However, with write latencies that bad, you’re either heavily overloading tempdb, the I/O subsystem is misconfigured, or there is a lot of other load on the I/O subsystem that’s dragging down your tempdb numbers.
Hey Paul,
Great post, thanks. I’ve been referring to it for months to get some ideas across to my SAN/infrastructure people.
When I read, “Only having a single tempdb data file so missing out on the usual higher I/O subsystem performance gained from having multiple data files in a filegroup” I had to wonder if I’ve been doing this wrong for years – when increasing the number of Tempdb data files, is there any reason/need to split them into different filegroups other than Primary?
I’ve just been adding the data files and keeping them in the Primary filegroup. Is this wrong?
Thanks,
Peter
If you’re suffering from I/O contention, then having all the files on the same portion of the I/O subsystem may or may not be an issue. It depends on the underlying I/O subsystem – a single drive will have problems with that, but a LUN with many spindles will not.
Paul,
My tempdb is very good and log files good by your reckoning. My data file is at 37ms for reads and 8 ms for writes. Should that be looked at in the same way as the temp and log files?
Thanks,
John
You definitely want to see why the read latency is so high, and why reads are occurring in the first place.
This issue I have is I receive alerts regarding read latency > 20 ms in some cases 2,034 ms for my tempdb. When i analyze my wait stats I don’t see any PAGE* related waits nearly that high. I also check my sys.dm_db_session_space_usage and didn’t notice anything there.. is there something I’m missing?
Paul,
I have an interesting situation with a server running an availability group on SQL2012 SP1 build 3412. This server has a number of databases but one smaller one, that is not used very much has a high read latency compared to other more heavily used databases. We appear to have very few queries against this database with one performing a couple of clustered index scans against a table with over 750,000 rows. So could the high read latency be due to the fact that when the query runs it has a high chance of needing to read data from disk rather than find it in cache?
We could add an index to make this need less I/O but is this worthwhile for a less used database?
Do you have any ideas?
Thanks
Chris
Paul,
I should have looked at your script a little more closely in that it was looking at TempDB and the transaction logs rather than the data files. Now I get a different picture that I should examine.
Please ignore my previous comment.
Chris
Here is what I’m facing, writes are off the chart, while reads seem to be good for my tempdb…any ideas other than I/O Subsystem?
physical_name name num_of_writes avg_write_stall_ms num_of_reads avg_read_stall_ms
S:\Databases\tempdb.mdf tempdev 12016686 402.88129838792492372 4809375 2.39073330734243014
S:\Databases\tempdb1.ndf tempdb1 10350184 404.33832538629264948 4100775 2.28213276758661472
T:\Databases\tempdb2.ndf tempdb2 12014808 425.15515237530221040 4808039 2.57044337618725638
U:\Databases\tempdb3.ndf tempdb3 12018700 423.91274996463843843 4804664 2.56826491925345872
Maybe check if you have a huge number of writes going to tempdb that are contributing to the I/O subsystem delays?
Hi Paul,
thank you for the excellent blog post.
In point 2.2. you talk about “Incorrect SAN settings, such as not having write-caching enabled […]”
Do you mean enabling/disabling the “Disk Write Caching” mentioned in http://support.microsoft.com/kb/259716/en-us or do you think of the write cache on storage box level?
Best regards,
Christoph
You’re welcome. Whatever is applicable to your I/O subsystem, that’s why I wasn’t specific.
Great article Paul. I’m seeing high disk wait stats (ReadLatency > 200) on a server that is showing low CPU usage. We have a windows service that hammers SQL Server and the CPU usage SHOULD be at 100%, but it’s only about 20% typically. The same app, on a different server, hits 100% usage. Would it make sense that slow disks are the cause of the low CPU usage, as the CPU is waiting?
Yes – if all the threads are having to wait for slow I/O.